






Abstract
Global manufacturing systems are being reshaped by recurring geopolitical, energy-market, and supply-chain shocks. The current petrochemical industry is especially exposed because its cost base depends on crude oil, natural gas liquids, naphtha, ethane, propane, power, freight, and risk premiums embedded in global trade. Building on the argument that post-2026 manufacturing should be understood through macroeconomic and geopolitical theories rather than as a temporary logistics disruption, this paper examines whether oil-price shocks transmit into petrochemical cost of goods sold (COGS), and whether those costs mean-revert after major shocks.
The study develops a U.S.-listed petrochemical peer group consisting of Dow, LyondellBasell, Eastman Chemical, Westlake, and Huntsman. It maps Brent crude oil-price movements against major events over the last two to three decades, then compares those events with annual COGS data from 2019 to 2025. The evidence shows that oil prices often normalize faster than petrochemical cost structures. Brent crude fell sharply after the 2008 financial crisis, recovered after the 2020 COVID-19 pandemic collapse, and cooled within months after the 2022 Russia-Ukraine energy shock. However, the selected petrochemical peer group’s aggregate COGS peaked in 2022 and returned close to the 2019 baseline only by 2025, indicating a cost-structure reversion period of roughly two to three years.
The paper concludes that petrochemical firms should plan around a two-stage recovery model. The first stage is commodity-price normalization, often measured in months. The second stage is cost-structure normalization, usually measured in years. This distinction matters because firms may still carry elevated COGS through inventories, contracts, logistics costs, energy prices, maintenance cycles, and demand weakness even after oil prices themselves have already reverted.
1. Introduction
Petrochemicals sit at the center of modern manufacturing. They supply inputs for plastics, packaging, construction materials, automotive components, electronics, textiles, fertilizers, and industrial intermediates. Because petrochemical production depends heavily on hydrocarbon feedstocks and energy, oil-price shocks can transmit rapidly into operating costs.
The existing abstract frames the future of the petrochemical industry as part of a broader transformation in manufacturing systems after the 2026 Iran conflict, where returning to “normality” should be understood through macroeconomic and geopolitical theories rather than as a short-term logistics issue. It also argues that upstream uncertainty in sectors such as petrochemicals, metals, and logistics can cascade into downstream sectors through production networks. This paper extends that argument by testing whether past oil-price shocks show a measurable pattern of COGS disruption and recovery.
The central research question is:
How long does it take petrochemical cost structures to return to normal after major oil-price shocks, and is there evidence of mean reversion that firms can use for planning?
The answer is important for strategy. If costs mean-revert quickly, firms can manage shocks through short-term hedging, inventory discipline, and working-capital controls. If costs remain elevated for years, firms need deeper resilience strategies, including feedstock flexibility, regional diversification, long-term energy contracts, supplier redundancy, and risk-aware investment planning.
2. Literature and Theoretical Framing
2.1 Production-Network Shocks
Production-network theory suggests that shocks in upstream sectors can spread across downstream industries when critical inputs become scarce, delayed, or more expensive. The active document explicitly applies this idea to petrochemicals, metals, and logistics, arguing that uncertainty in upstream industries can act as an adverse supply shock that cascades into downstream sectors. This is particularly relevant for petrochemicals because the sector is both an upstream supplier to manufacturing and a downstream consumer of oil, gas, power, and logistics services.
2.2 Mean Reversion and Cost Normalization
Mean reversion, in this paper, refers to the tendency of prices or costs to return toward a prior baseline after a shock. For oil prices, the baseline can be measured using monthly or annual Brent crude prices. For petrochemical firms, the baseline can be measured using COGS indexed to a pre-shock year.
This study defines “normal” in operational terms:
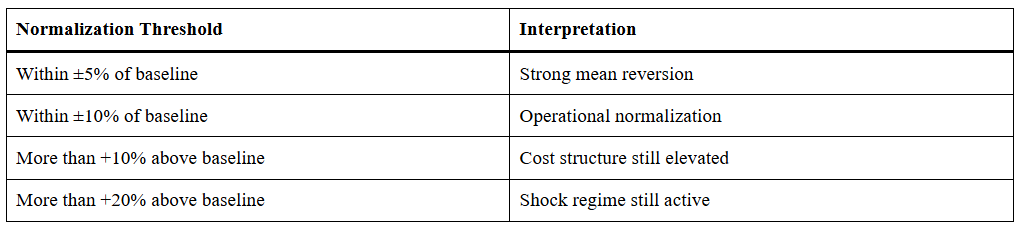
For the company analysis, 2019 is used as the baseline because it is the last full pre-COVID-19 pandemic year and the first year for which all selected peer companies can be compared on a consistent basis.
3. Data and Methodology
3.1 Oil-Price Data
The oil-price analysis uses Brent crude oil data from the U.S. Energy Information Administration (EIA). EIA annual Brent data show that Brent averaged $28.66 per barrel in 2000, $96.94 in 2008, $111.26 in 2011, $111.63 in 2012, $43.64 in 2016, $41.96 in 2020, $100.93 in 2022, and $80.52 in 2024. EIA monthly Brent data are used to estimate the speed of reversion after discrete shocks, including the 2008 financial crisis, the 2020 COVID-19 pandemic collapse, and the 2022 Russia-Ukraine energy shock.
3.2 Peer Group
The peer group consists of five U.S.-listed petrochemical and chemical producers:
- Dow
- LyondellBasell
- Eastman Chemical
- Westlake
- Huntsman
This group was selected because it includes large public companies with available annual COGS data and meaningful exposure to petrochemical, polymer, intermediate chemical, specialty chemical, and downstream industrial markets.
3.3 COGS Data
Annual COGS data are collected from publicly available financial sources for each company via their published financial statements and aggregated financial data platforms.
3.4 Index Construction
Each company’s annual COGS is indexed to 2019 = 100. The index is calculated as:

Peer-group total COGS is calculated by summing the five companies’ annual COGS values. The peer-group index is calculated using the same 2019 = 100 method.
4. Oil-Price Event Map, 2000 to 2024
Table 1 maps major oil-price events over the last two to three decades. The purpose is to identify the external shocks most likely to affect petrochemical feedstock and energy costs.
Table 1 – Major Oil-Price Events and Petrochemical Relevance

Source: EIA Brent annual price data.
EIA notes that crude oil and petroleum product prices can be affected by geopolitical and weather-related developments that disrupt supply flows or create uncertainty about future supply and demand. EIA also states that oil-price volatility is linked to the low short-run responsiveness of supply and demand, meaning large price changes may be needed to rebalance markets aftershocks.
5. Peer-Group COGS Analysis
Table 2 – Annual COGS by Company, 2019 to 2025
All values are in millions of U.S. dollars.

Source data: Dow, LyondellBasell, Eastman, Westlake, Huntsman. Peer-group total is calculated from the company values.
Table 3 – Indexed COGS by Company, 2019 = 100

Source data are the company COGS sources listed in Table 2. Index values are author calculations from those sourced COGS values.
6. Graphs and Chart-Ready Visualizations
Figure 1. Brent Crude Annual Average Price, Selected Shock Years

Source: EIA annual Brent crude price data.
Figure 2. Peer-Group Total COGS, 2019 to 2025
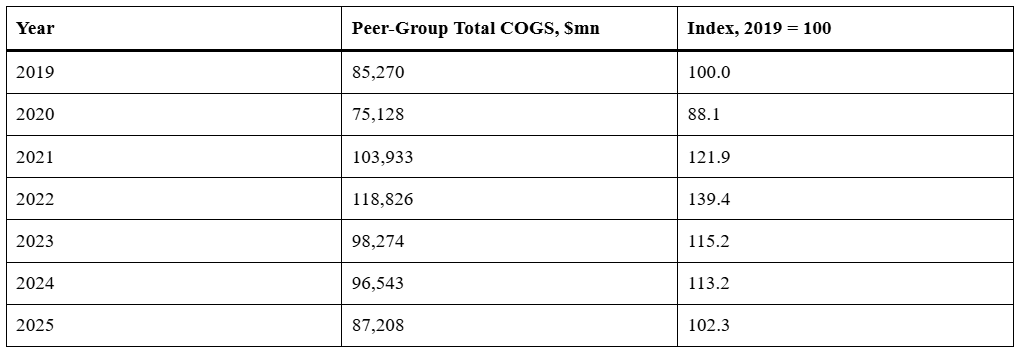
Source data are the company COGS sources listed in Table 2. Peer-group totals and index values are author calculations from those sourced values.
Figure 3. Company-Level Indexed COGS, 2019 = 100
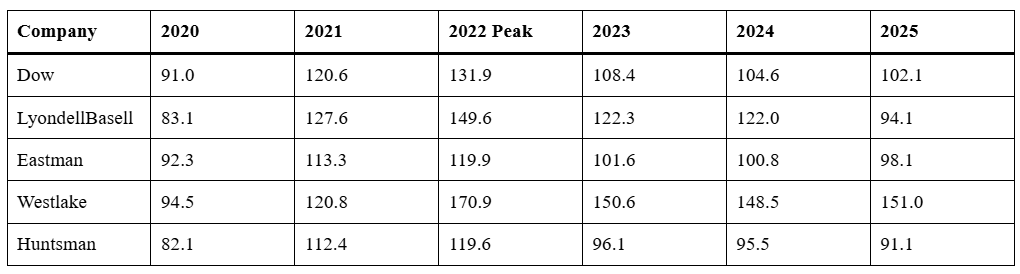
Source data are the company COGS sources listed in Table 2. Index values are author calculations.
Interpretation: Westlake shows the highest and most persistent COGS elevation, while Huntsman, Eastman, Dow, and LyondellBasell show stronger mean reversion by 2025.
7. Mean-Reversion Analysis
7.1 Oil Prices Revert Faster Than Petrochemical COGS
The strongest empirical pattern is that oil prices often revert faster than petrochemical cost structures. In 2008, Brent peaked at $132.72 per barrel in July and fell to $39.95 by December, a collapse over roughly five months. In 2020, Brent fell from $63.65 in January to $18.38 in April, then recovered to $62.28 by February 2021, implying an oil-price recovery of roughly 10 months from April through back to the pre-shock range. In 2022, Brent peaked at $122.71 in June and fell to $80.92 by December, meaning the oil-price spike cooled within roughly six months.
By contrast, peer-group COGS did not return close to the 2019 baseline until 2025. Aggregate peer COGS fell to 88.1 in 2020, rose to 121.9 in 2021, peaked at 139.4 in 2022, remained elevated at 115.2 in 2023 and 113.2 in 2024, and returned close to baseline at 102.3 in 2025. These values are calculated from annual COGS data for Dow, LyondellBasell, Eastman, Westlake, and Huntsman.
7.2 Estimated Time-to-Normal by Shock Type

This classification is consistent with EIA’s explanation that geopolitical disruptions can create uncertainty and risk premiums in oil markets, and with the active document’s argument that structural risk premiums can delay repair in the real economy beyond financial-market recovery.
7.3 Company-Level Differences
The peer-group average hides major company-level variation. Eastman returned close to baseline by 2023 to 2024, and Huntsman moved below its 2019 baseline by 2023. Dow returned within about 5% of the 2019 baseline by 2024. LyondellBasell remained elevated in 2023 and 2024 but reverted by 2025. Westlake did not revert by 2025, with COGS still around 151.0 on a 2019-indexed basis.
This suggests that mean reversion is not automatic at the company level. It depends on product mix, feedstock exposure, acquisition effects, pricing power, customer end markets, regional cost structure, and whether the firm is more exposed to commodity-cycle inputs or downstream construction and infrastructure demand.
8. Discussion
8.1 Why Do COGS Lag Oil-Price Normalization?
Oil prices are spot and futures market variables, while COGS is an accounting and operating-cost measure. This difference creates a lag. A petrochemical company may still carry high-cost inventory after oil prices decline. It may also have energy contracts, freight contracts, maintenance schedules, labor costs, and supplier agreements that reset more slowly than spot crude oil.
The supply-chain framework helps explain this lag. If upstream uncertainty creates adverse supply shocks across petrochemicals, logistics, metals, and related sectors, then downstream normalization will be fractured rather than immediate. In other words, oil-price mean reversion is only the first stage of recovery.
8.2 The COVID-19 Pandemic as a Special Case
The COVID-19 pandemic shock shows why lower oil prices do not automatically improve petrochemical conditions. Brent fell sharply in 2020, with monthly Brent dropping from $63.65 in January to $18.38 in April. Peer-group COGS also fell from $85.270 billion in 2019 to $75.128 billion in 2020. However, this decline reflected a demand shock rather than a simple margin benefit. When demand recovered in 2021, peer-group COGS rose to $103.933 billion, exceeding the 2019 baseline.
8.3 The 2022 Shock as the Clearest Test Case
The 2022 Russia-Ukraine energy shock provides the clearest evidence of delayed cost normalization. Brent peaked in June 2022 and cooled by December 2022. Yet peer-group COGS remained materially elevated in 2023 and 2024, only returning close to baseline in 2025.
This means that petrochemical firms should not assume that cost normalization follows immediately after oil-price normalization. A more realistic assumption is:
- Oil-Price Shock Recovery: 6 to 18 months.
- Petrochemical COGS Recovery: 24 to 36 months.
- Structural Conflict or Sanctions Recovery: potentially longer than 36 months, or a permanent reset.
8.4 Strategic Implications
The evidence supports a shift from cost efficiency alone toward resilience and integration capability. This aligns with the active document’s argument that competitive advantage may move from analytical cost efficiency to the ability to align localized data, redundant tools, and risk-aware decision processes.
For managers, this means planning should include:
- Feedstock Flexibility: Firms should increase optionality between ethane, propane, naphtha, and other feedstocks where technically feasible.
- Inventory Strategy: Firms should model inventory cost lags because high-cost inventory can keep COGS elevated after oil prices fall.
- Energy Contracting: Firms should evaluate fixed, floating, and hybrid energy contracts to manage delayed cost effects.
- Scenario Planning: Firms should distinguish short shocks from structural geopolitical regimes.
- Working-Capital Planning: Firms should expect cash pressure to remain elevated after headline oil prices normalize.
- Regional Resilience: Firms should evaluate whether production footprints are exposed to high-cost or geopolitically vulnerable regions.
9. Conclusion
This paper finds that petrochemical cost structures show evidence of mean reversion, but the process is slower and more uneven than oil-price reversion. Oil prices can normalize within months after a discrete shock, while petrochemical COGS often requires one to three years to return toward baseline.
The 2022 shock is the most important recent case. Brent crude cooled within roughly six months after its June 2022 peak. However, the selected petrochemical peer group’s aggregate COGS did not return close to its 2019 baseline until 2025, implying a cost-structure normalization period of roughly three years.
The main planning lesson is that petrochemical firms should use a two-stage recovery model. The first stage is commodity-price normalization, which can happen relatively quickly. The second stage is cost-structure normalization, which is slower because it includes inventories, contracts, logistics, maintenance cycles, energy costs, and demand recovery. In future geopolitical shocks, firms that plan only around spot oil prices may underestimate how long their operating cost base remains distorted.
© Copyright 2026. The views expressed herein are those of the author(s) and not necessarily the views of Ankura Consulting Group, LLC, its management, its subsidiaries, its affiliates, or its other professionals. Ankura is not a law firm and cannot provide legal advice.

