






Executive Summary
The broader retail sector shows no significant signs of weakness. Year-over-year (YOY) sales rose 5.0% in July, above the roughly 4.7% long-run average.[9] The National Retail Federation projects 4.4% growth for 2026, ahead of the decade’s 3.6% norm.[10,11,13] What weakness exists is concentrated in home furnishings, an interest-rate-sensitive category and the only major segment posting YOY declines, with furniture down for six straight months as consumers delay big-ticket purchases.[12] Elsewhere, spending is bifurcating rather than shrinking: Value chains and off-price retailers are gaining share while premium, loyalty-driven brands hold up, squeezing the undifferentiated middle from both sides. Retail’s health depends on where you look. The topline is relatively healthy, one category is dragging it down, and the real casualty is mid-tier apparel and home retailers with neither a price nor loyalty advantage to fall back on.
Retail is not weakening; it is splitting. The headline number says consumers are still spending, but the real story is where the dollars are going: toward low-cost certainty at one end and emotionally defensible premium purchases at the other.
This shift is structural, not cyclical. Income and wealth polarization has concentrated more spending power in fewer hands, and inflation fatigue has made households more deliberate about which purchases are worth defending. Together, these forces are pulling spend out of the middle: mid-tier apparel, casual dining, and aspirational brands are all losing ground. Packaged goods are following the same pattern, with private-label snack and beverage lines gaining share and recent growth concentrated in indulgent, premium-positioned products.[1] Deep-value and true-premium categories keep growing at either end of the spectrum.[1-4] The takeaway for brands and retailers is the same: Stop trying to be all things to all shoppers.
This paper lays out the evidence, the drivers beneath it, a framework for diagnosing where a category or brand sits, and the implications for portfolio strategy, pricing, and innovation.
Key Findings
- High-income households now account for close to half of all U.S. consumer spending, and that share is rising.
- A wealth effect from rising asset values is amplifying the divide. Consumers with the largest stock holdings are far more likely to say favorable asset values have improved their finances, and their sentiment now runs more than 30% above that of non-stockholders.[7]
- Even within a single category, spend concentrates around perceived value, not just income. Prestige fragrance grew 6% in H1 2026 entirely on price — units stayed flat as consumers traded up into pricier EDP and perfume formats — while mass fragrance grew faster in dollars (+15%) but through genuine volume growth (units +7%).[15]
- Deep-value formats, including off-price retail, warehouse clubs, and private label, are simultaneously gaining share.[1-3]
- Mid-tier department stores, aspirational brands, and mid-priced casual dining have seen some of the sharpest declines and store closures of the past two years.[5-6]
- Trading down and trading up are not different people. The same households are reallocating budget toward what they value.
The Evidence: Spending Is Piling up at Both Ends
For the past few years, higher-income households have been pulling ahead while lower-income households fell behind. That trend is now intensifying. Spend is piling up at both ends of the income and price spectrum, and the middle is thinning out.
The top 10% of U.S. earners now account for nearly half of all consumer spending, up from roughly 43% in 2020. Bank of America research shows the wage and spending gap between the top third and bottom third of the income distribution reached its widest point since the bank’s data series began in 2015, as of March 2026.[16] Total U.S. credit and debit card spending rose 4.3% YOY in March 2026, the strongest pace since early 2023, with higher-income households’ spending growth remaining well ahead of middle- and lower-income cohorts.[16] At the same time, lower-income consumers have retrenched doubling down on deal-seeking and promotion sensitivity.[14]
Nearly half of all U.S. consumer spending now comes from the top 10% of earners, up from roughly 43% in 2020. That shift is large enough to reshape which retailers win, which brands hold pricing power, and which mid-tier propositions get squeezed.
Exhibit 1. The Top Decile Now Accounts for Roughly Half of U.S. Consumer Spending
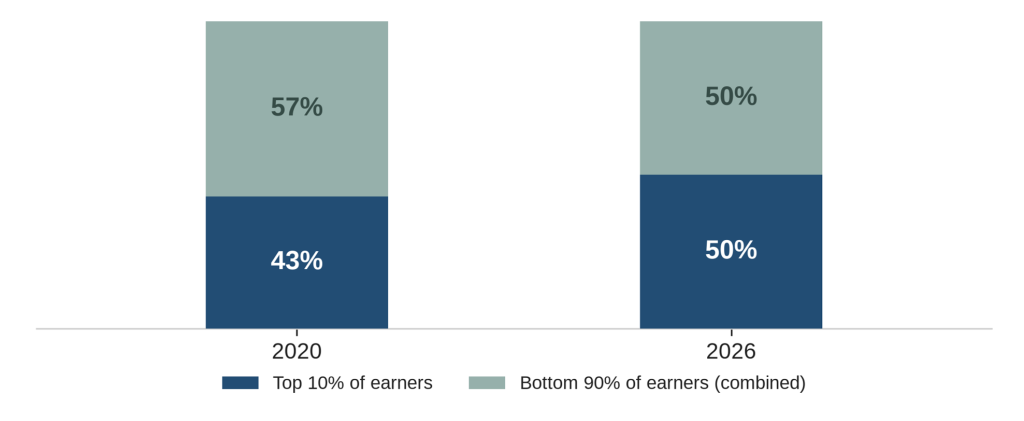
Source: Bloomberg analysis of Federal Reserve data, citing Moody’s Analytics (September 2025).
What Is Driving the Split?
Income and asset polarization and inflation fatigue are the two forces that most directly explain this shift in consumer behavior. They work in different ways, but they push in the same direction: away from the middle.
Income and Asset Polarization
Asset owners have benefited from several years of strong equity and home-price appreciation, while wage growth for lower- and middle-income households has been eroded by inflation. Two consumer populations have formed with very different discretionary income trajectories, shopping in the same stores and the same digital channels.
Rising asset values reinforce the divide through a wealth effect: Households who feel richer because their portfolio or home equity has grown tend to keep spending even when broader sentiment sours. Total U.S. household net worth reached a record $183 trillion in the first quarter of 2026, but that gain is concentrated among asset owners rather than spread evenly across the population.[7] University of Michigan Surveys of Consumers data make the mechanism visible. In June 2026, 28% of consumers in the top tercile of stock holdings cited favorable asset values as a reason their personal finances had improved, versus 8% in the middle tercile and 4% among those with the smallest holdings.[7] Sentiment among the wealthiest consumers has run more than 30% above that of non-stockholders in recent months even as overall consumer sentiment sits near multi-year lows.[7] This is a large part of why premium categories keep growing while the middle erodes. It is not only an income story, it is a balance-sheet story, which means trade-up behavior should track equity and home-price cycles more closely than it tracks income growth.
This is not just an income story; it is a balance-sheet story. Consumers with meaningful stock exposure are feeling wealthier even as broad sentiment remains weak, helping explain why premium categories can keep growing while mainstream offerings stall.
Inflation Fatigue and the Redefinition of Value
After several years of price increases, households have stopped treating every purchase equally. Consumers have split spending into two categories: one they will trade down on without hesitation, and one they will defend even under pressure. The first is commoditized, covering cleaning supplies, staple groceries, and basic apparel. The second carries emotional, social, or experiential weight, covering travel, celebrations, status goods, and any category the shopper personally cares about. Value no longer means a low price. It means a price appropriate to the benefit delivered. A $9 premium private-label item can feel like better value than a $7 mid-tier national brand once the quality gap has closed, and a $400 concert ticket can feel like better value than a $150 one if the experience is the point of the purchase.
Where It Shows Up: Category by Category
Private labels are gaining trust at one end while premium tiers keep growing at the other. U.S. private-label sales have reached $330 billion, capturing a 24% unit share and 23% dollar share of the total CPG market, with club channels now driving nearly half of all private-label growth.[1] Warehouse clubs continue to post continued strength in membership (BJ’s +9.8% fee income growth) and renewal rates above 90% (Costco Q3 FY26 92.2%) even after recent membership fee increases.[2] Discount retailers have outperformed the broader sector as value-seeking intensifies, but the lead is narrowing. Superstores are posting a notable acceleration in store traffic off an already large base, and the discount sector’s traditional lower-income customer base is shrinking as SNAP participation has fallen roughly 12%, or 5.3 million people, since enactment of the One Big Beautiful Bill Act, with the impact varying by state.[8] With demand cooling from a shrinking core customer and superstore competition intensifying, profitability discipline rather than traffic and share alone will increasingly separate the winners from the losers in discount.[8]
Private label has moved from substitute to strategy. At $330 billion in U.S. sales and roughly a quarter of CPG unit share, it is no longer just a cheaper alternative; it is a mainstream value platform.
Exhibit 2. Private Label Now Captures Roughly a Quarter of the U.S. CPG Market
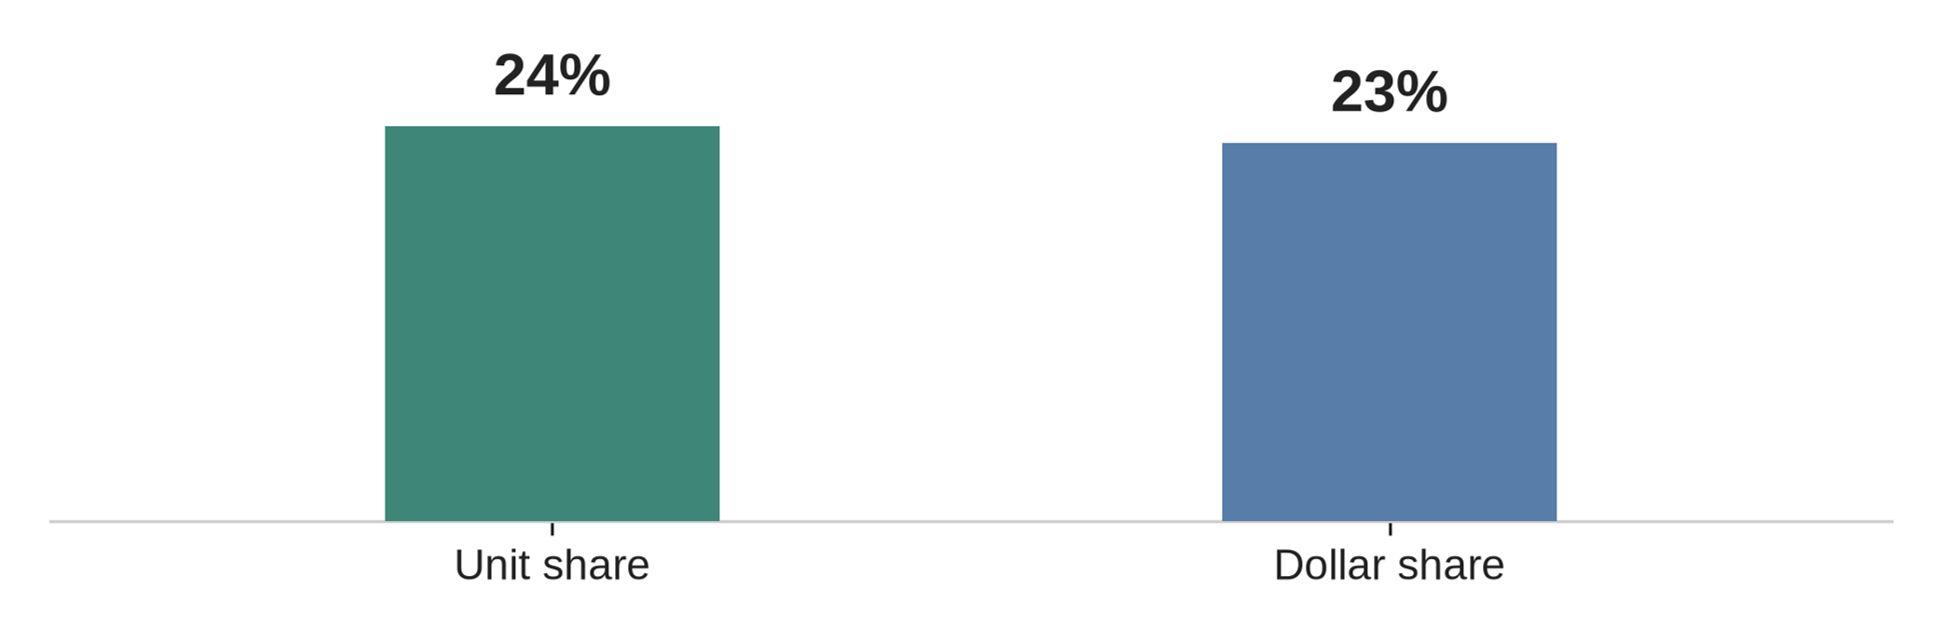
Source: Circana, reported via PLMA (March–April 2026).[1]
The same value-driven bifurcation shows up inside a single retail category once you separate dollar growth from unit growth. In prestige fragrance, sales rose 6%, while units remained flat… average prices increased 5%, meaning a significant portion of that growth came from consumers choosing to spend more per bottle rather than buying more bottles.[15] They did this by trading up into higher-concentration formats, with EDP and perfume posting double-digit growth — paying more specifically for the version of the product that feels more premium, not simply because they had more money to spend.[15] Mass fragrance grew faster in headline dollar terms, but its growth was driven by genuine volume expansion rather than price alone: Sales jumped 15%, while units increased 7%, meaning buyers were purchasing more, not necessarily trading up within the category.[15] Circana’s own read on the data lands squarely on this distinction: Beauty continues to benefit from consumers’ willingness to shop across price tiers, selectively investing in products that deliver the strongest emotional and functional value.[15] Even within a single category, spend concentrates wherever a product credibly signals more value — whether that value is functional, as in mass fragrance’s broader adoption, or emotional, as in prestige’s price-led premiumization.
Fragrance shows the new value equation in miniature. Prestige grew because shoppers paid more per bottle, while mass grew because more shoppers bought in — proof that trade-up and trade-down can happen in the same aisle at the same time.
The same split repeats across every major consumer category, with a credible trade-down option gaining share at one end and a defensible premium holding or growing at the other.
Exhibit 3. Value and Premium Signals by Category
| Category | Value / Trade-Down Signal | Premium / Trade-Up Signal |
| Packaged Food | Private label has reached roughly a quarter of U.S. unit share and about $330 billion in sales, and is still growing.[1] | Premium-tier private-label snack and beverage lines are outgrowing mainstream private label.[1] |
| Grocery Retail | Warehouse clubs sustain renewal rates above 90% and continue opening new locations.[2] | Specialty and premium grocery formats hold share with affluent, quality-driven shoppers. |
| Apparel and Department Stores | Off-price chains (TJX, Ross, Burlington) guide to continued comparable-sales growth and store expansion.[3] | True luxury houses with pricing power keep growing even as mid-tier bridge brands post double-digit declines. |
| Dining | Quick-service and value menus hold traffic; larger, less frequent grocery trips substitute for eating out. | Reservation-only and experiential fine dining sustain demand while full-service casual dining contracts sharply.[6] |
| Durables and Autos | Used-vehicle and value-tier demand remains firm as new-vehicle affordability worsens. | Ultra-premium marques report multi-year order backlogs and price increases with no volume loss. |
Source: Company earnings releases and industry data as cited; see Sources 1 through 6.
A Framework for Diagnosing Position
For any retailer or brand owner, the difficulty is that the middle is not a fixed shelf position. It is a judgment the customer makes, which makes it hard for companies to say with confidence which side of the divide their own portfolio sits on. Two questions settle it. First, is the underlying need commoditized or differentiated in the customer’s mind? Second, does the purchase carry low or high emotional and social stakes for the buyer? Plotting a category against those two axes places it in one of four positions, each with a different defensible strategy and a different set of operating levers.
Exhibit 5. The Consumer Value Equation: Diagnosing Where a Brand Sits
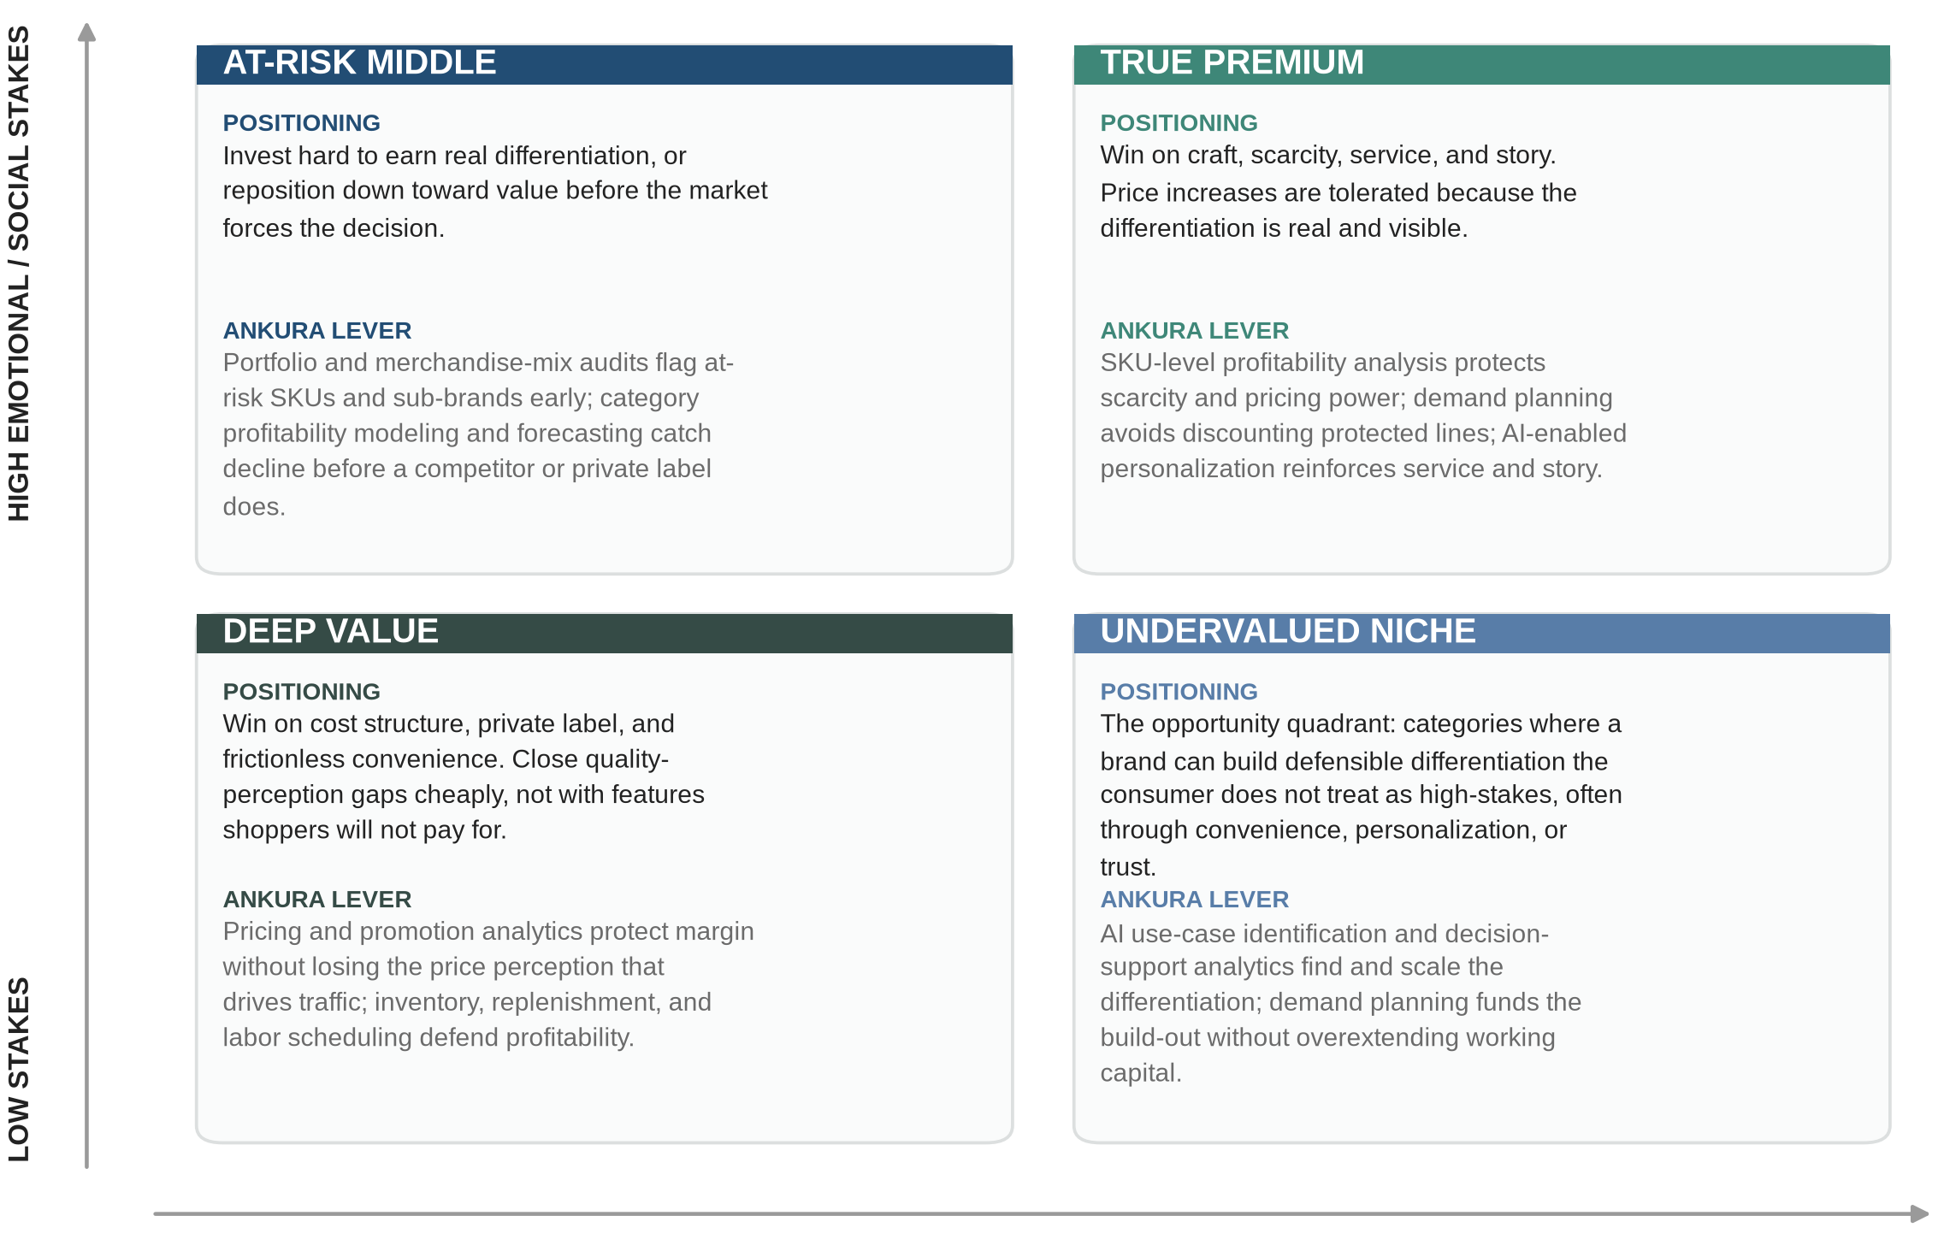
Source: Ankura Performance Improvement analysis.
The at-risk middle is where most of this cycle’s erosion is concentrated: a purchase the customer still treats as high-stakes, in a category they have come to see as commoditized. Deep value and true premium are both defensible, but on opposite terms, one on cost structure and convenience and the other on craft, scarcity, and story. The undervalued niche is the opportunity, where a brand can build differentiation the consumer does not yet treat as high-stakes. Knowing which quadrant a business occupies determines where resources will produce the most improvement.
The strategic question is no longer whether a brand is premium or value. It is whether customers believe the price is justified by the benefit — and whether the operating model can defend that position.
What Leaders Should Do Next
Ankura’s Performance Improvement team turns this framework into an action plan built around what retailers and brand owners need to do next:
- Audit the portfolio before the market does. Flag products and sub-brands sitting in the at-risk middle before a competitor or a private label forces the issue.
- Pressure-test premium claims. Confirm where a brand can genuinely defend a premium in the customer’s mind, and where that positioning is more assumption than fact.
- Realign assortment to actual demand. Apply pricing and promotion analytics, category profitability modeling, and merchandise-mix and demand-planning tools to match the shopper’s current mindset rather than last year’s.
- Protect margin where value competition is fiercest. In deep-value and discount categories, use inventory and working-capital optimization, labor scheduling and productivity analysis, and AI-enabled forecasting and process automation to defend EBITDA.
- Know where you stand and where you are headed. Use exposure identification and defensible-positioning analysis to understand not just today’s position but where the category is trending next.
The consumer has not stopped spending. They have become far more selective about where the money goes, and they are making that judgment category by category rather than brand by brand. The businesses that come through this cycle strongest will be the ones that decide, deliberately and early, which end of the spectrum they intend to win.
Sources
- Circana LLC, “Private Labels in the U.S.: Meeting Consumers Where They Are” and “Category Transformation or Simply Competition: A Global Private Label Perspective,” reported via PLMA (March 2026).
- Costco Wholesale Corporation, Q3 FY2026 earnings release (May 2026); BJ’s Wholesale Club Holdings, Q3 FY2025 earnings release.
- The TJX Companies, Ross Stores, and Burlington Stores, Q1 FY2027/FY2026 earnings releases and investor guidance (2026).
- LVMH and Compagnie Financière Richemont, first-half/Q2 2026 earnings releases, as reported by WWD (July 2026).
- Nation’s Restaurant News, “9% of Full-Service Restaurants Are at Risk for Closure in 2026” (March 6, 2026), 2026 store-closure and bankruptcy trackers
- Retail Dive, Newsweek, and The Hill, 2026 store-closure and bankruptcy trackers (Macy’s, Saks Global, and mid-tier casual dining chains).
- University of Michigan Surveys of Consumers, monthly survey releases and featured charts on wealth and stockholding divergence (February–July 2026); Board of Governors of the Federal Reserve System, Distributional Financial Accounts, household net worth (Q1 2026 data).
- Ankura Performance Improvement, “Discount Sector Spotlight” (August 2026), citing S&P Capital IQ, Placer.ai, and USDA Food and Nutrition Service SNAP participation data.
- U.S. Census Bureau, “Advance Monthly Sales for Retail and Food Services,” July 2026 release (August 14, 2026);.
- National Retail Federation, 2026 retail sales forecast (4.4% year-over-year growth to approximately $5.6 trillion), State of Retail and the Consumer address (March 2026).
- CNBC/NRF Retail Monitor, powered by Affinity Solutions, monthly releases (March–July 2026).
- Retail Dive, “In the home sector, ‘the weak will get weaker’ this year” (March 2026).
- Matthews, “The Biggest U.S. Retail Trends Defining 2026 So Far” (May 2026).
- Bank of America Institute, “Consumer Checkpoint: Choppy Start, Solid Finish” (January 2026).
- Circana LLC, “US Beauty Industry Posts Solid First-Half Growth as Fragrance and Skincare Lead Across Prestige and Mass Retail” (August 11, 2026).
- Bank of America Institute, “The madness of March” (April 2026).
© Copyright 2026. The views expressed herein are those of the author(s) and not necessarily the views of Ankura Consulting Group, LLC, its management, its subsidiaries, its affiliates, or its other professionals. Ankura is not a law firm and cannot provide legal advice.

