






Why Mid-Market OEE Stays Stuck in the Mid-60s, and Where the Real Leverage Sits
It is Monday morning. The operations’ review starts at 9 a.m. Three plant managers dial in, each with a different overall equipment effectiveness (OEE) number for the same product line. The CFO asks which one is right. Nobody answers, because the honest answer is none of them, and everyone in the room knows it.
This is the meeting. You have sat in it. Your portfolio companies are sitting in it this week.
Across mid-market manufacturing, OEE plateaus in the mid-60s; with regulatory-driven industries like medical and cosmetics ahead of specialty. Leadership suspects the real number is worse — upon implementing automated systematic measurement, OEE may drop an additional 10%-25% — and boards are pushing for the gap to close. Quarter after quarter the debate never ends, because the underlying data fragments across ERP, MES, SCADA, and CMMS systems (Fiix, eMaint, Infor) were never designed to talk to each other. Each plant runs its own stack, and similar events are logged differently, timestamped inconsistently, or not at all.
Welcome to the decision dead zone: the space between what leadership feels is broken and what they can prove. Inside that gap, waste compounds quarter after quarter. Operators know exactly where the money is leaking, but the organization has no structured way to get that knowledge out of their heads and into management action before it dissipates.
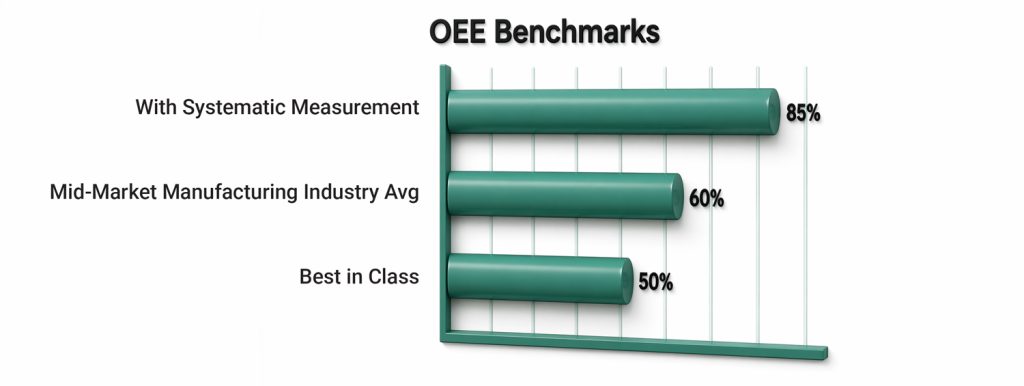
Sources: Evocon (2024) for 85% and 60%, Jitbase (2025) & Ankura research for 10% drop
Three structural barriers explain why this gap persists and survives every generation of digital transformation investment thrown at it:
- The “Other” Problem. Why the biggest category in your downtime Pareto is the one nobody can explain.
- The Maintenance Knowledge Gap. Why your richest root-cause data lives in your technicians’ heads, and walks when they leave.
- The Modernization Trap. Why the three-year ERP program will not fix this.
Reframe #1: ‘Other’ Is the Most Honest Data You Have
It is 2 a.m. on third shift. A line has just stopped. The changeover is already behind. The shift manager is watching. The operator has 47 dropdown options in front of her describing every possible cause of downtime. None of them fits what just happened.
So she picks “Other,” gets the line running, and gets back to work.
Across the plant, across the shift, across the month, this happens thousands of times. And it is only half the story. Industry research finds that manual tracking misses up to 40% of downtime events entirely. In cases like these, short stoppages go unrecorded, and root causes are rarely logged. Of what does get captured, a meaningful share ends up bucketed under “Other” or “Unknown” because nothing in the taxonomy fits.
The standard consulting read is that this is a tracking failure, fixable with better operator training and data hygiene. That reading misses the signal in the “Other” bucket, and it sends improvement investment in precisely the wrong direction.
| “Other” is not a data gap. It is feedback that your taxonomy is broken, and operators are giving it to you every shift. Nobody is listening because nobody has a way to hear. |
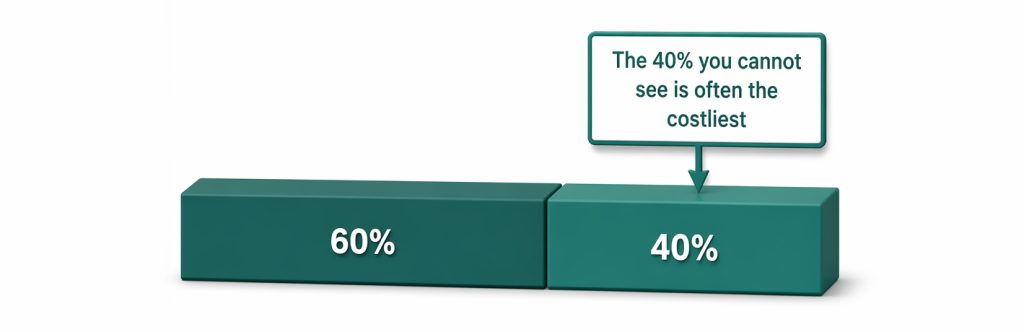
Source: Oxmaint (2026)
Below “Other,” there is a second grave: the free-text comment field. Thousands of handwritten observations sit in MES fields and shift notes (things like “film feed slipped again, same as last Tuesday” or “bearing noise on #4, fourth time this month”), and nobody has the time to read them. The root-cause story is already written in your own data; no one has turned on the light to read it.
- Ranked causes do not exist. Leadership cannot Pareto what was never categorized.
- Pattern recognition is impossible. The intermittent jam on line three looks random, but it is the third instance of the same failure mode this month, masked by three different “Other” selections from three different operators.
- CI teams chase fires. Without real cause ranking, improvement work drifts to whatever is loudest, not what is most valuable.
Reframe #2: Your Best Data Is Not in Any System
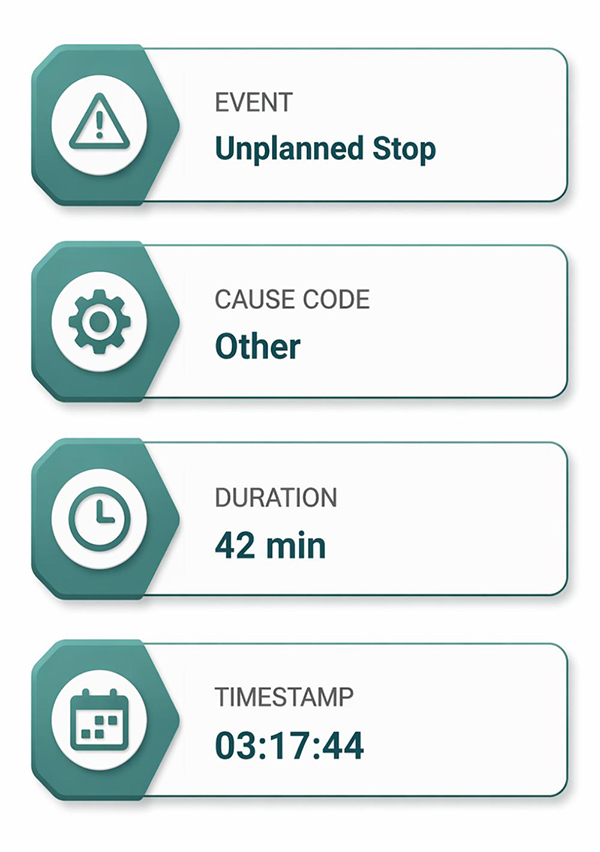
Even when a stoppage is captured cleanly — with clean timestamp, proper cause code, and correct asset ID — the system captures only the symptom. A motor trips, a line jams, a unit stops, and the system dutifully records the event, producing a data record that contains the what but not the why.
The system does not know this is the third time this month. It does not know the lube schedule got pushed back during the Q2 staffing cut, or that a maintenance tech noticed bearing noise two weeks ago and flagged it in a text thread that never reached any system. It does not know the real failure is three layers upstream, in inlet temperature drift.
On the shop floor, the cause sits three layers deep. Cameras, sensors, and structured dropdowns only ever reach layer one.
The same downtime event, seen two ways:
What the System Logs
Structured. Clean. Searchable. Shallow.
What Your Technicians Know
Unstructured. Scattered. Valuable. Invisible.
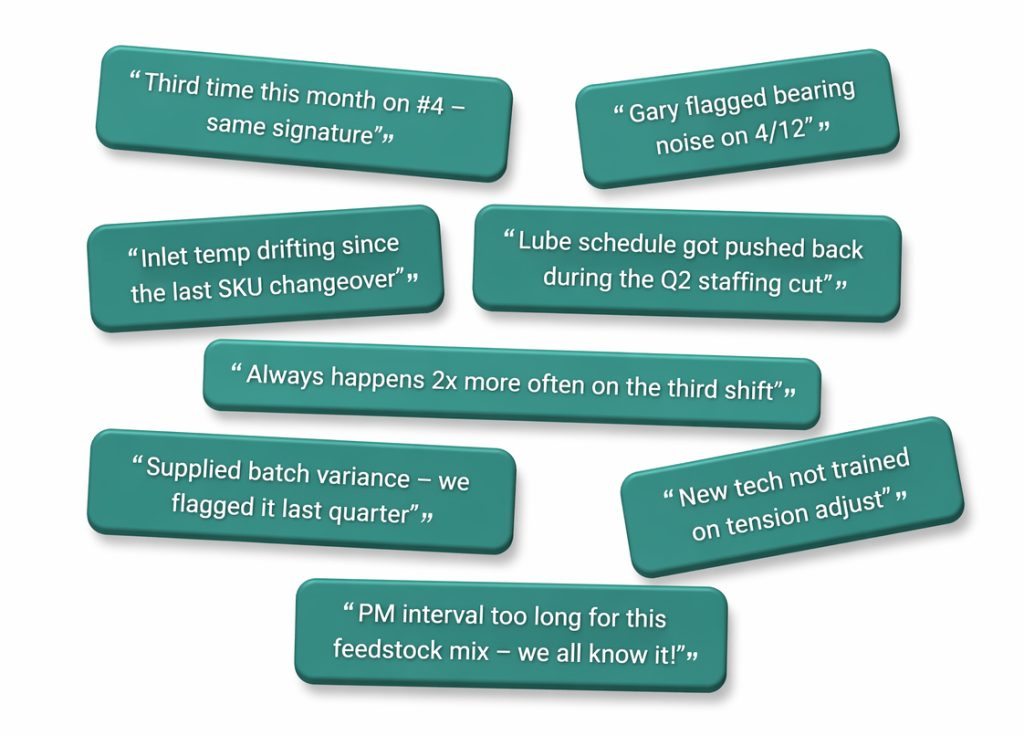
The people who do see layer three are your maintenance technicians, and they have always known. What they cannot do is get the knowledge out of their heads fast enough, because the structure that would let them — a disciplined after-action report for every major breakdown — does not exist in most mid-market shops. Maintenance teams are running to the next breakdown, so nobody has built the time for structured AARs into the operating rhythm; techs finish stabilizing line four and immediately get called to line seven.
So, the knowledge stays in their heads. It surfaces partially — in hallway conversations, shift handovers, scrawled margin notes on work orders. Mostly, it walks out the door when a senior tech retires, and a new one comes in cold.
| This is the point most AI pitches skip because it is uncomfortable: You cannot automate your way out of a knowledge-capture problem. More sensors will not help if the root cause requires interpretation sensors cannot provide. |
Reframe #3: The Modernization Trap
The executive reflex when confronted with this picture is to reach for the biggest hammer available: a multi-year ERP modernization, a new MES deployment, or a plant-wide SCADA standardization.
These programs are not a bad choice, but they are almost always the wrong answer to this particular problem. A three-year ERP rollout does not fix the “Other” taxonomy, does not capture the maintenance technician’s head knowledge, and does not surface the pattern hiding in existing MES comments. The data model gets standardized, the knowledge gap stays open, and the waste compounds for another three years while the program runs.
Luckily, there is a different path. Make the data you already have accessible, contextual, and trusted, and pair it with lightweight capture of the knowledge that currently never reaches any system. This work can start in weeks — not years — and compounds faster than any platform rollout.
An Example of How Manufacturers Can Start Down This Pathway
The Situation
A mid-sized consumer packaged goods (CPG) manufacturer faced persistent challenges in plant operations:
- Unplanned line downtime (8%-12% of available production time)
- Slow and inconsistent issue identification
- Limited visibility into root causes of speed losses and defects
- Manual, paper-based documentation with delayed reporting
Solution Overview
The company implemented an AI-enabled operational intelligence system combining:
- iPads in rugged industrial cases deployed on the factory floor
- Real-time data capture apps (iOS-based) for operators
- Wi-Fi-connected centralized database
- Video/optical line monitoring systems
- AI/ML models to detect patterns, anomalies, and root causes
How It Works
1. Digital Data Capture (Edge Layer)
Operators use iPads to log:
- Downtime events
- Changeovers
- Quality incidents
- Speed losses
- Freeform text-based reasons “why”
Entries are standardized via structured forms and dropdowns, along with freeform text-based reasons why, and data is transmitted instantly via secure Wi-Fi to a cloud/database backend. This approach eliminates lag, improves data accuracy, and increases reporting compliance.
2. Video and Optical Line Capture
Cameras installed along key production lines capture:
- Line speed consistency
- Equipment stoppages
- Material flow issues (e.g., jams, misfeeds)
Computer vision analyzes micro-stoppages — previously invisible to logs — cycle time deviations, and visual defects. This captures “hidden losses” that operators may miss or underreport.
3. AI-Driven Analysis (Core Engine)
AI models ingest structured iPad data, reasons why, and unstructured video/optical signals. The models then automatically detect patterns and correlations like downtime spikes during certain SKU production or shifts and identify root causes such as material variability, operator practices, and machine wear. AI can then recommend corrective actions, such as maintenance scheduling improvements, process parameter adjustments, and operator retraining.
Key Success Factors
- Operator-friendly UX on iPads drove adoption
- Integration of human input, AI, and video data (not AI alone)
- Real-time feedback loops led to faster decision-making
- Scalable architecture (can expand across plants)
Conclusion
By combining iOS-based data capture, video/optic line monitoring, and AI-driven analytics, the manufacturer transformed its operations from…
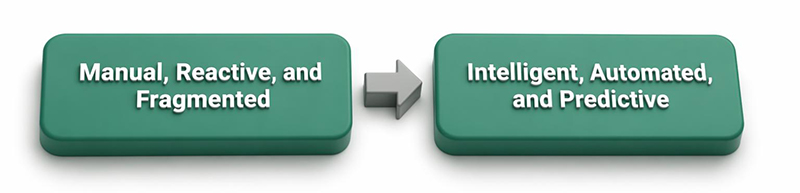
This approach enables manufacturers to identify issues faster, understand true causes of downtime and speed loss, and continuously optimize production performance at scale.
The next ops review did not debate the numbers. It debated where to start.
How Ankura Can Help
Ankura Value Creation partners with mid-market manufacturers and their PE sponsors to maximize EBITDA and cash flow with a focus on rapid results. Our manufacturing engagements follow Ankura’s 3D framework:
• Diagnose — Rapidly assess the operation to quantify loss drivers hiding in existing data, unstructured context, and maintenance knowledge across plants.
• Define — Develop quantified, sustainable goals and a targeted operating plan ranked by dollar impact across plants, products, and shifts.
• Deliver — Execute side-by-side with management to lock in gains, enhance plant utilization, staffing, and scheduling, and build internal capability.
What It Is Like to Work With Ankura Value Creation
Ankura Value Creation approaches its projects as partnerships. We do not succeed unless our clients succeed. In addition to leveraging the breadth of experience within the Value Creation team, we are able to leverage the breadth of Ankura’s multiple operating groups to provide unparalleled subject matter expertise.
Our projects are typically a flexible model of in-person work coupled with remote data analysis and research. We flex our coverage to support your business, teams, and goals.
Driving Strategic Business Transformation, Margin, and EBITDA
Comprehensive evaluation of manufacturing and retail operations that include the following areas of focus to support customer and employee satisfaction.
- Manufacturing Network Strategy
- Mfg. Operations – Capacity / Utilization / Cost Efficiency
- Merchandise Assortment Breadth and Depth
- Procurement and Supply Chain
- Distribution and Logistics
- Store Operations
- Customer Relationship
- Digital Marketing
- Planning and Allocation
- Finance and Accounting
- Technology and Systems
- Labor Scheduling and Optimization
We have a proven track record of executing strategic plans to achieve sustainable performance improvement and targeted operating results aimed at maximizing EBITDA, cash flow, and ultimately shareholder value.
© Copyright 2026. The views expressed herein are those of the author(s) and not necessarily the views of Ankura Consulting Group, LLC, its management, its subsidiaries, its affiliates, or its other professionals. Ankura is not a law firm and cannot provide legal advice.

